
In the most depressing March Madness contest around, the “winner” doesn’t really win at all.
Ah, the signs of spring. The air is warming up, the flowers are beginning to bloom, and millions of Americans are readying to crowd into their local sports bar to watch 64 college basketball teams (plus the play-ins!) square off in the annual NCAA men's basketball tournament.
It's March Madness!
As part of this yearly ritual, millions of Americans also will fill out an tournament bracket, attempting to determine what teams will win each game, make it into the Final Four and prevail in the overall tournament. It can be a frustrating process — the odds of filling out a perfect bracket are 1 in 9.2 quintillion — but here at the Alliance for American Manufacturing (AAM), we're here to help.
Last year, AAM created our official March Madness bracket by using the numbers from an Economic Policy Institute (EPI) report on how many jobs would be created if currency manipulation ended. However, this tme around we did things a little differently, as our picks stem from the recent EPI report on the nearly 900,000 U.S. jobs lost in 2013 due to the trade deficit with Japan.
First, we determined which congressional district each college team calls home, and then used the number of jobs that were lost in that district in 2013 to fill things out. So in our bracket, losers were winners — the team whose district saw the more jobs lost moved on. As for tiebreakers? The team who had more jobs displaced as a share of district unemployment captured the win.
It's an admittedly depressing way to figure out the winner, but we wanted to highlight the important point that trade deficits with countries like Japan aren't just wonky political numbers thrown around by economists.
Trade imbalances like the 2013 deficit with Japan cost hundreds of thousands of Americans their jobs, and if the proposed Trans-Pacific Partnership (TPP) is approved without a strong, enforceable provision prohibiting currency manipulation, things will get much worse for American workers.
So AAM's NCAA bracket serves as a way to showcase how thousands of people living in these college communities are impacted by unfair trade.
Let's break things down:
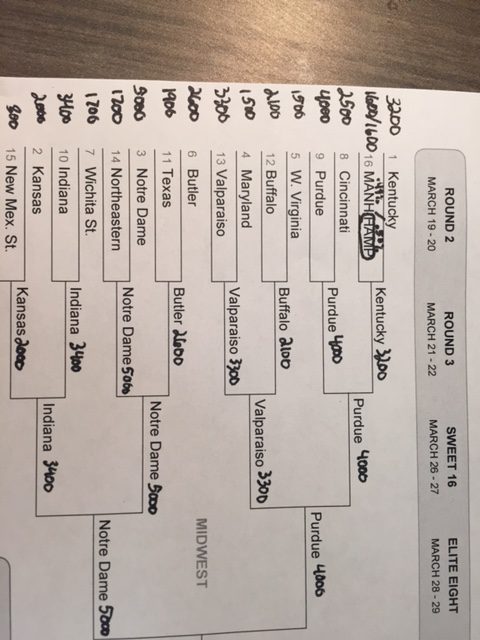
In the Midwest division, powerhouses Purdue and Indiana easily make their way through, with 4,000 and 3,400 jobs lost respectively. However, South Bend, Ind.-based Notre Dame soars through, having lost 5,000 jobs in 2013.
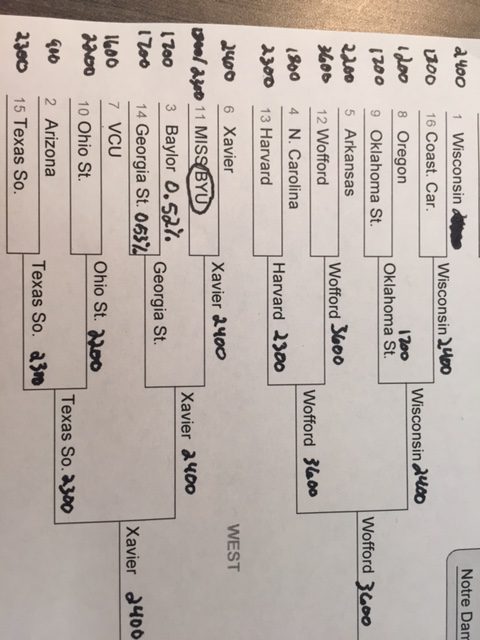
Over in the West division, Spartanburg, S.C. school Wofford soars ahead, having lost 3,600 jobs in 2013.
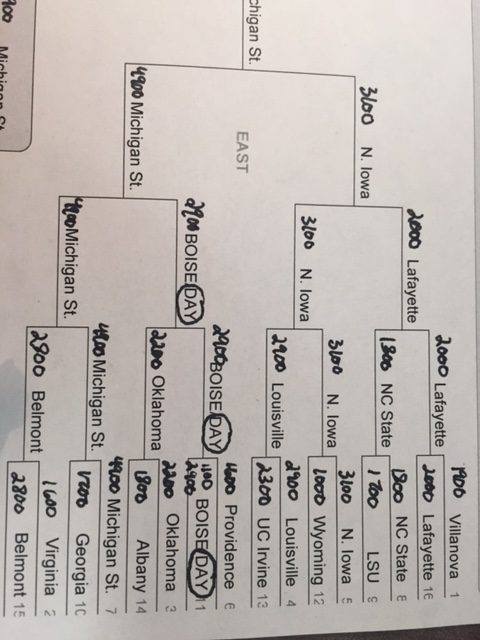
The East division is particularly "competitive," as the districts home to Northern Iowa, Louisville, Dayton and Belmont all saw significant job loss in 2013 due to unfair trade with Japan. However, Michigan State dominates the division, as its district in Lansing, Mich. saw a whopping 4,900 jobs lost.
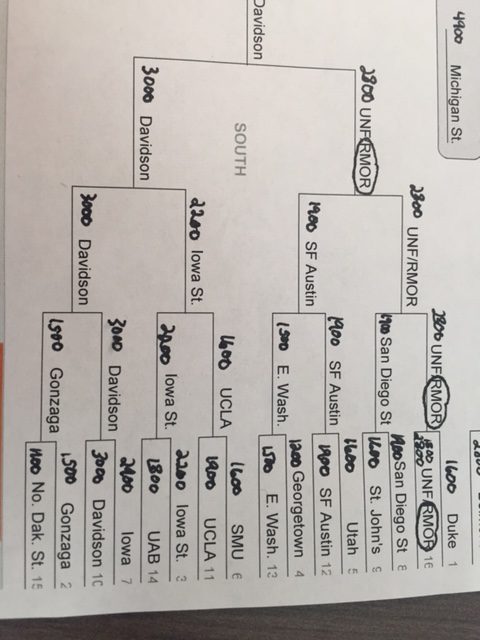
Davidson dominates the South, with 3,000 jobs lost in 2013.
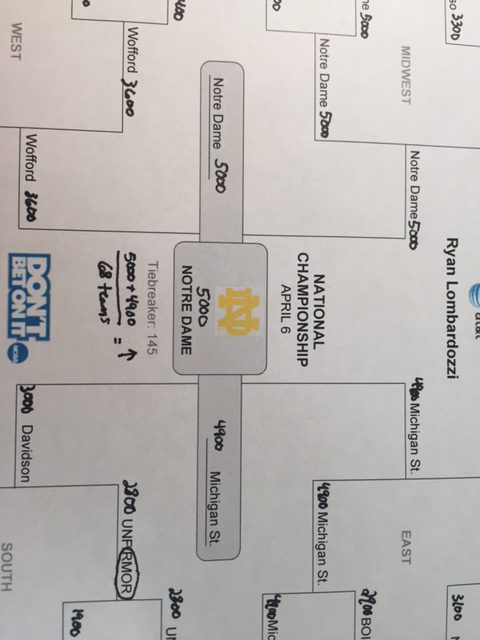
All four schools reside in districts that saw significant job loss due to the trade deficit with Japan in 2013. But Notre Dome edges out Michigan State in the finals, with 5,000 jobs lost to 4,900 jobs lost.
(Indiana and Michigan, we note, also top the list for states who saw the most jobs lost in 2013. Michigan comes out on top in that contest, having lost 56,200 jobs compared to Indiana's 33,700.)
So here's to the Fighting Irish! Congrats… or something.
Ryan Lombardozzi contributed to this post.